Turn Your Data Into Insight
Artstep’s real-time analytics give schools a clear view of academics, finances, and student learning — all in one dashboard, accessible 24/7.
.png?x-oss-process=image%2Fresize%2Cw_3840%2Fquality%2Cq_80%2Fformat%2Cwebp)
Why Schools Rely on Artstep Analytics
- Drowning in manual reports?
- Hard to track class hours and attendance?
- Struggling to follow tuition and payments?
- No visibility into student learning?
- Need constant updates?
Core Reporting Areas
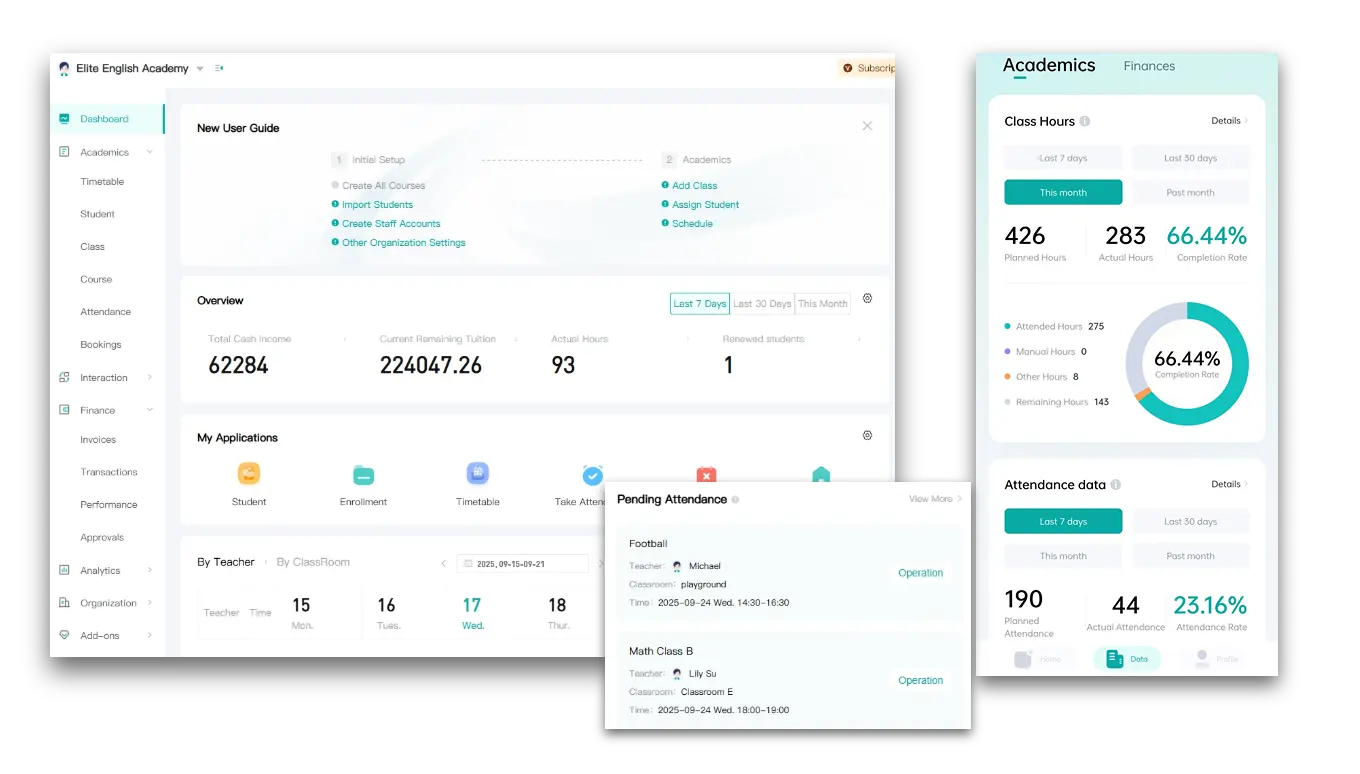
Academics Analytics
Track class hours (planned vs. attended), attendance trends, and renewal ratios.
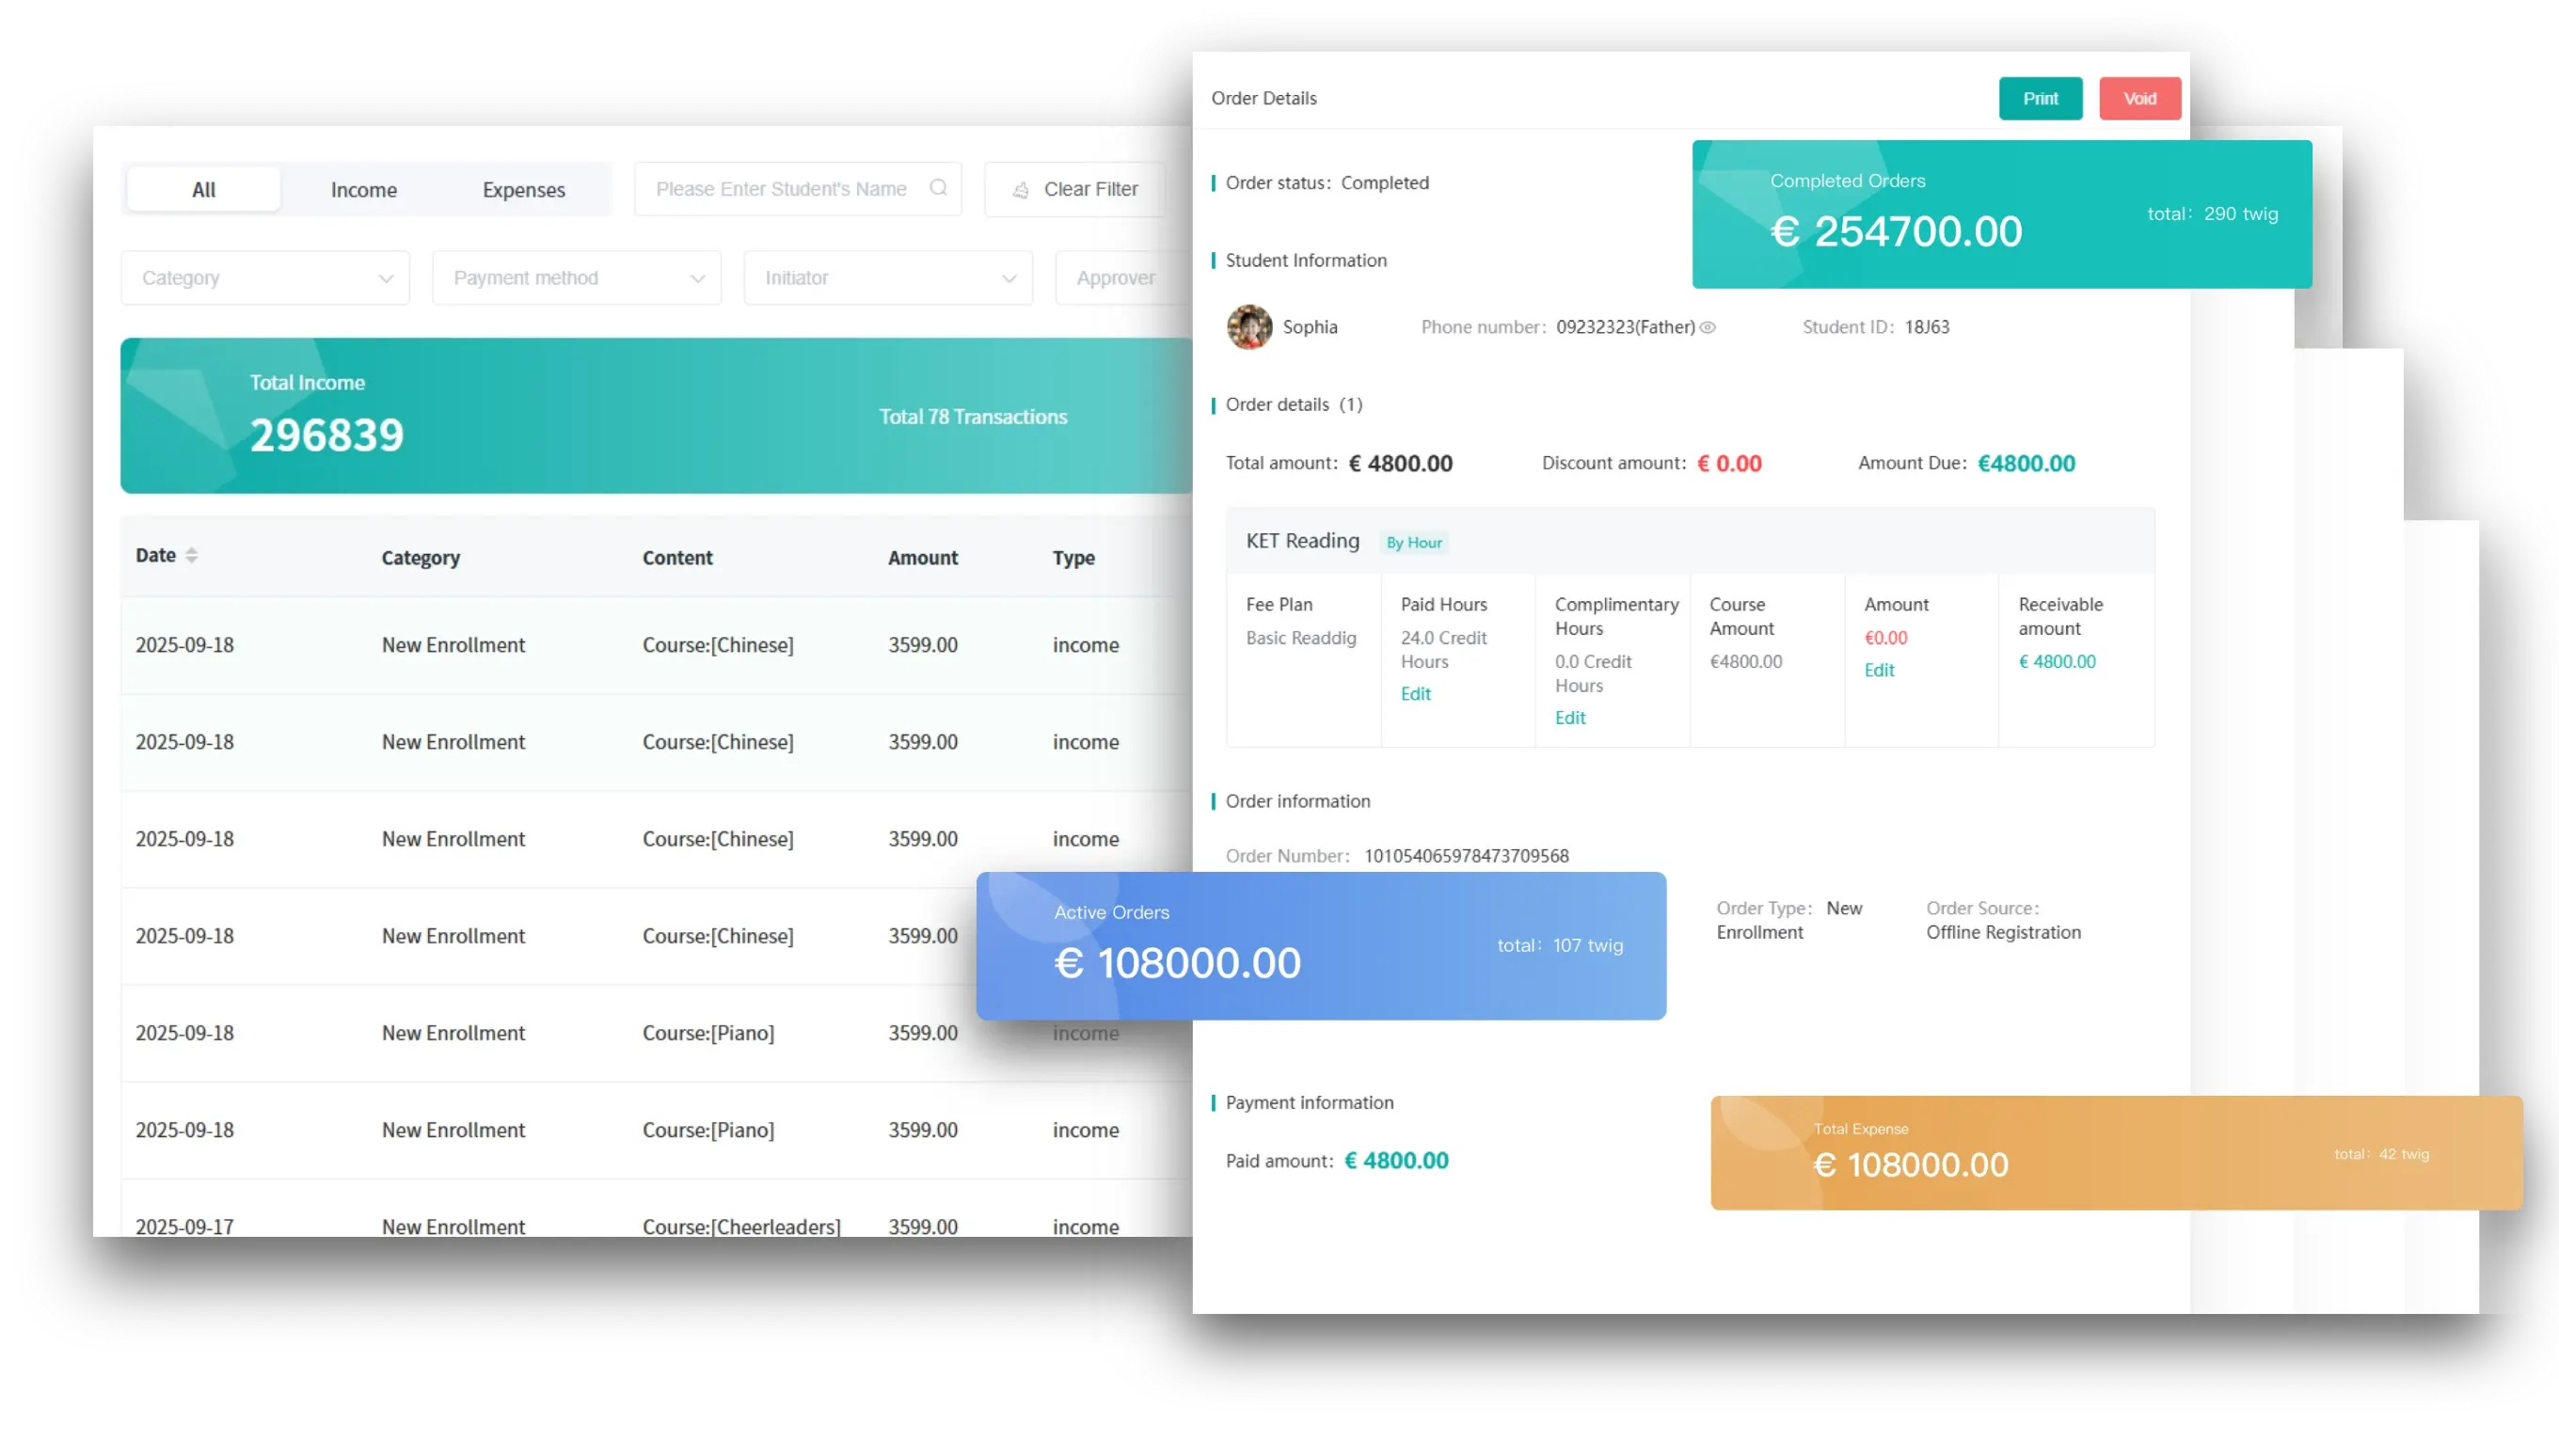
Finance Analytics
See tuition income, expenses, overdue payments, and cash flow at a glance.
Teaching Analytics
Monitor student learning with assignment submissions, grading completion, and performance distribution.
 (1).png?x-oss-process=image%2Fresize%2Cw_3840%2Fquality%2Cq_80%2Fformat%2Cwebp)
Visual Dashboards 24/7
Real-time charts and summaries update continuously, so your team always works with the latest facts.
.png?x-oss-process=image%2Fresize%2Cw_3840%2Fquality%2Cq_80%2Fformat%2Cwebp)
Benefits of Artstep Analytics
- Save time with automatic, always-up-to-date dashboards
- Gain clarity across academics, finance, and teaching in one place
- Spot trends early and take action proactively
- Build trust with transparent data for staff, parents, and stakeholders
“Before Artstep, we spent hours every week compiling attendance and tuition reports. Now, everything is visual and real-time — we can focus on decisions, not spreadsheets.”
— Director, Global Language Academy